Introduction
powerly is an R package developed to provide support for researchers who wish to perform power analysis. At its core, powerly is based on the method proposed by Constantin et al. (2023), which takes the form of a three-step algorithm designed to iteratively search for an optimal sample size, given some user input. It takes as input a set of hypothesized true model parameters (i.e., an effect size), a performance measure of interest and its corresponding target value (e.g., a sensitivity of ), and a statistic that describes how the performance measure value should be reached (e.g., reaching a sensitivity of with a probability of ). The search for the optimal sample size is conducted in three steps, starting with a Monte Carlo simulation step for computing the performance measure and statistic at various sample sizes within a candidate sample size range. It continues with a monotone curve-fitting step for interpolating the statistic. The final step employs stratified bootstrapping to quantify the uncertainty around the fitted curve. For more details, consult the manuscript (i.e., or the preprint for better formatting) or check out the tutorial section.
Next, I will provide a quick overview on how to get started with powerly, list the main functions available in the package, and highlight the main steps involved in using powerly for running a power analysis.
TIP
If you are interested in building upon or extending powerly, check out the Developer Section where the package API and the design choices are discussed in detail.
Installation
You can install the latest version of powerly from CRAN (i.e., the official R package repository) running the following command:
install.packages("powerly")
Alternatively, you can install the latest development version from GitHub via:
Click to expand optional step.
# Install the `remotes` package if necessary.
install.packages("remotes")
remotes::install_github("mihaiconstantin/powerly")
TIP
You may consult the News or the GitHub releases for an overview of the latest changes in the development version.
Functions
powerly exports three functions available to researchers for conducting sample size analysis.
| Function Name | Description |
|---|---|
generate_model | Used for generating true models parameters when manually specifying them is non-trivial. |
powerly | The main function of the package implementing the sample size calculation method described above. |
validate | Used for assessing the quality of the sample size recommendation obtained after running the powerly function. |
TIP
Check out the Reference Section corresponding to each function for detailed information about the available arguments and the output provided.
Usage
We start by attaching the powerly package.
# Load the package.
library(powerly)
Suppose we want to find the sample size required to observe a sensitivity of with a probability of for an arbitrary Gaussian Graphical Model (GGM) consisting of nodes with an edge density of .
We start by specifying the true model (i.e., in this case an edge weights matrix encoding of partial correlation coefficients), or we can generate one using the generate_model function. For example, this can be achieved by running:
Click to see the seed used for reproducibility.
We may set a seed to ensure that we generate the same true model. While this will not lead to the exact same sample size recommendation for each repeated run of the method (i.e., due to the randomness involved in the Monte Carlo procedure), the method will still, on average, provide the optimal sample size value (i.e., around for this particular example).
# Set a seed.
set.seed(20031993)
# Generate a `GGM` model.
true_model <- generate_model(
    type = "ggm",
    nodes = 10,
    density = .4
)
Then, we can supply the true_model object to the powerly function to start the search for the sample size. Alongside the true_model we may also specify a number of other arguments that constitute the method parameters.
TIP
You may also run ?powerly in R to bring up the documentation and learn more about the role of each argument in the powerly function.
# Run the method.
results <- powerly(
    range_lower = 300,
    range_upper = 700,
    samples = 30,
    replications = 40,
    measure = "sen",
    statistic = "power",
    measure_value = .6,
    statistic_value = .8,
    model = "ggm",
    model_matrix = true_model,
    cores = 7,
    verbose = TRUE
)
At this point we can summarize the results.
# Summarize the method run.
summary(results)
 Method completed:
 - duration: 2.94 seconds
 - converged: yes (1 iterations)
 - performance measure: `sen` (target: 0.6)
 - statistic: `power` (target: 0.8)
 - sample size recommendation: 531
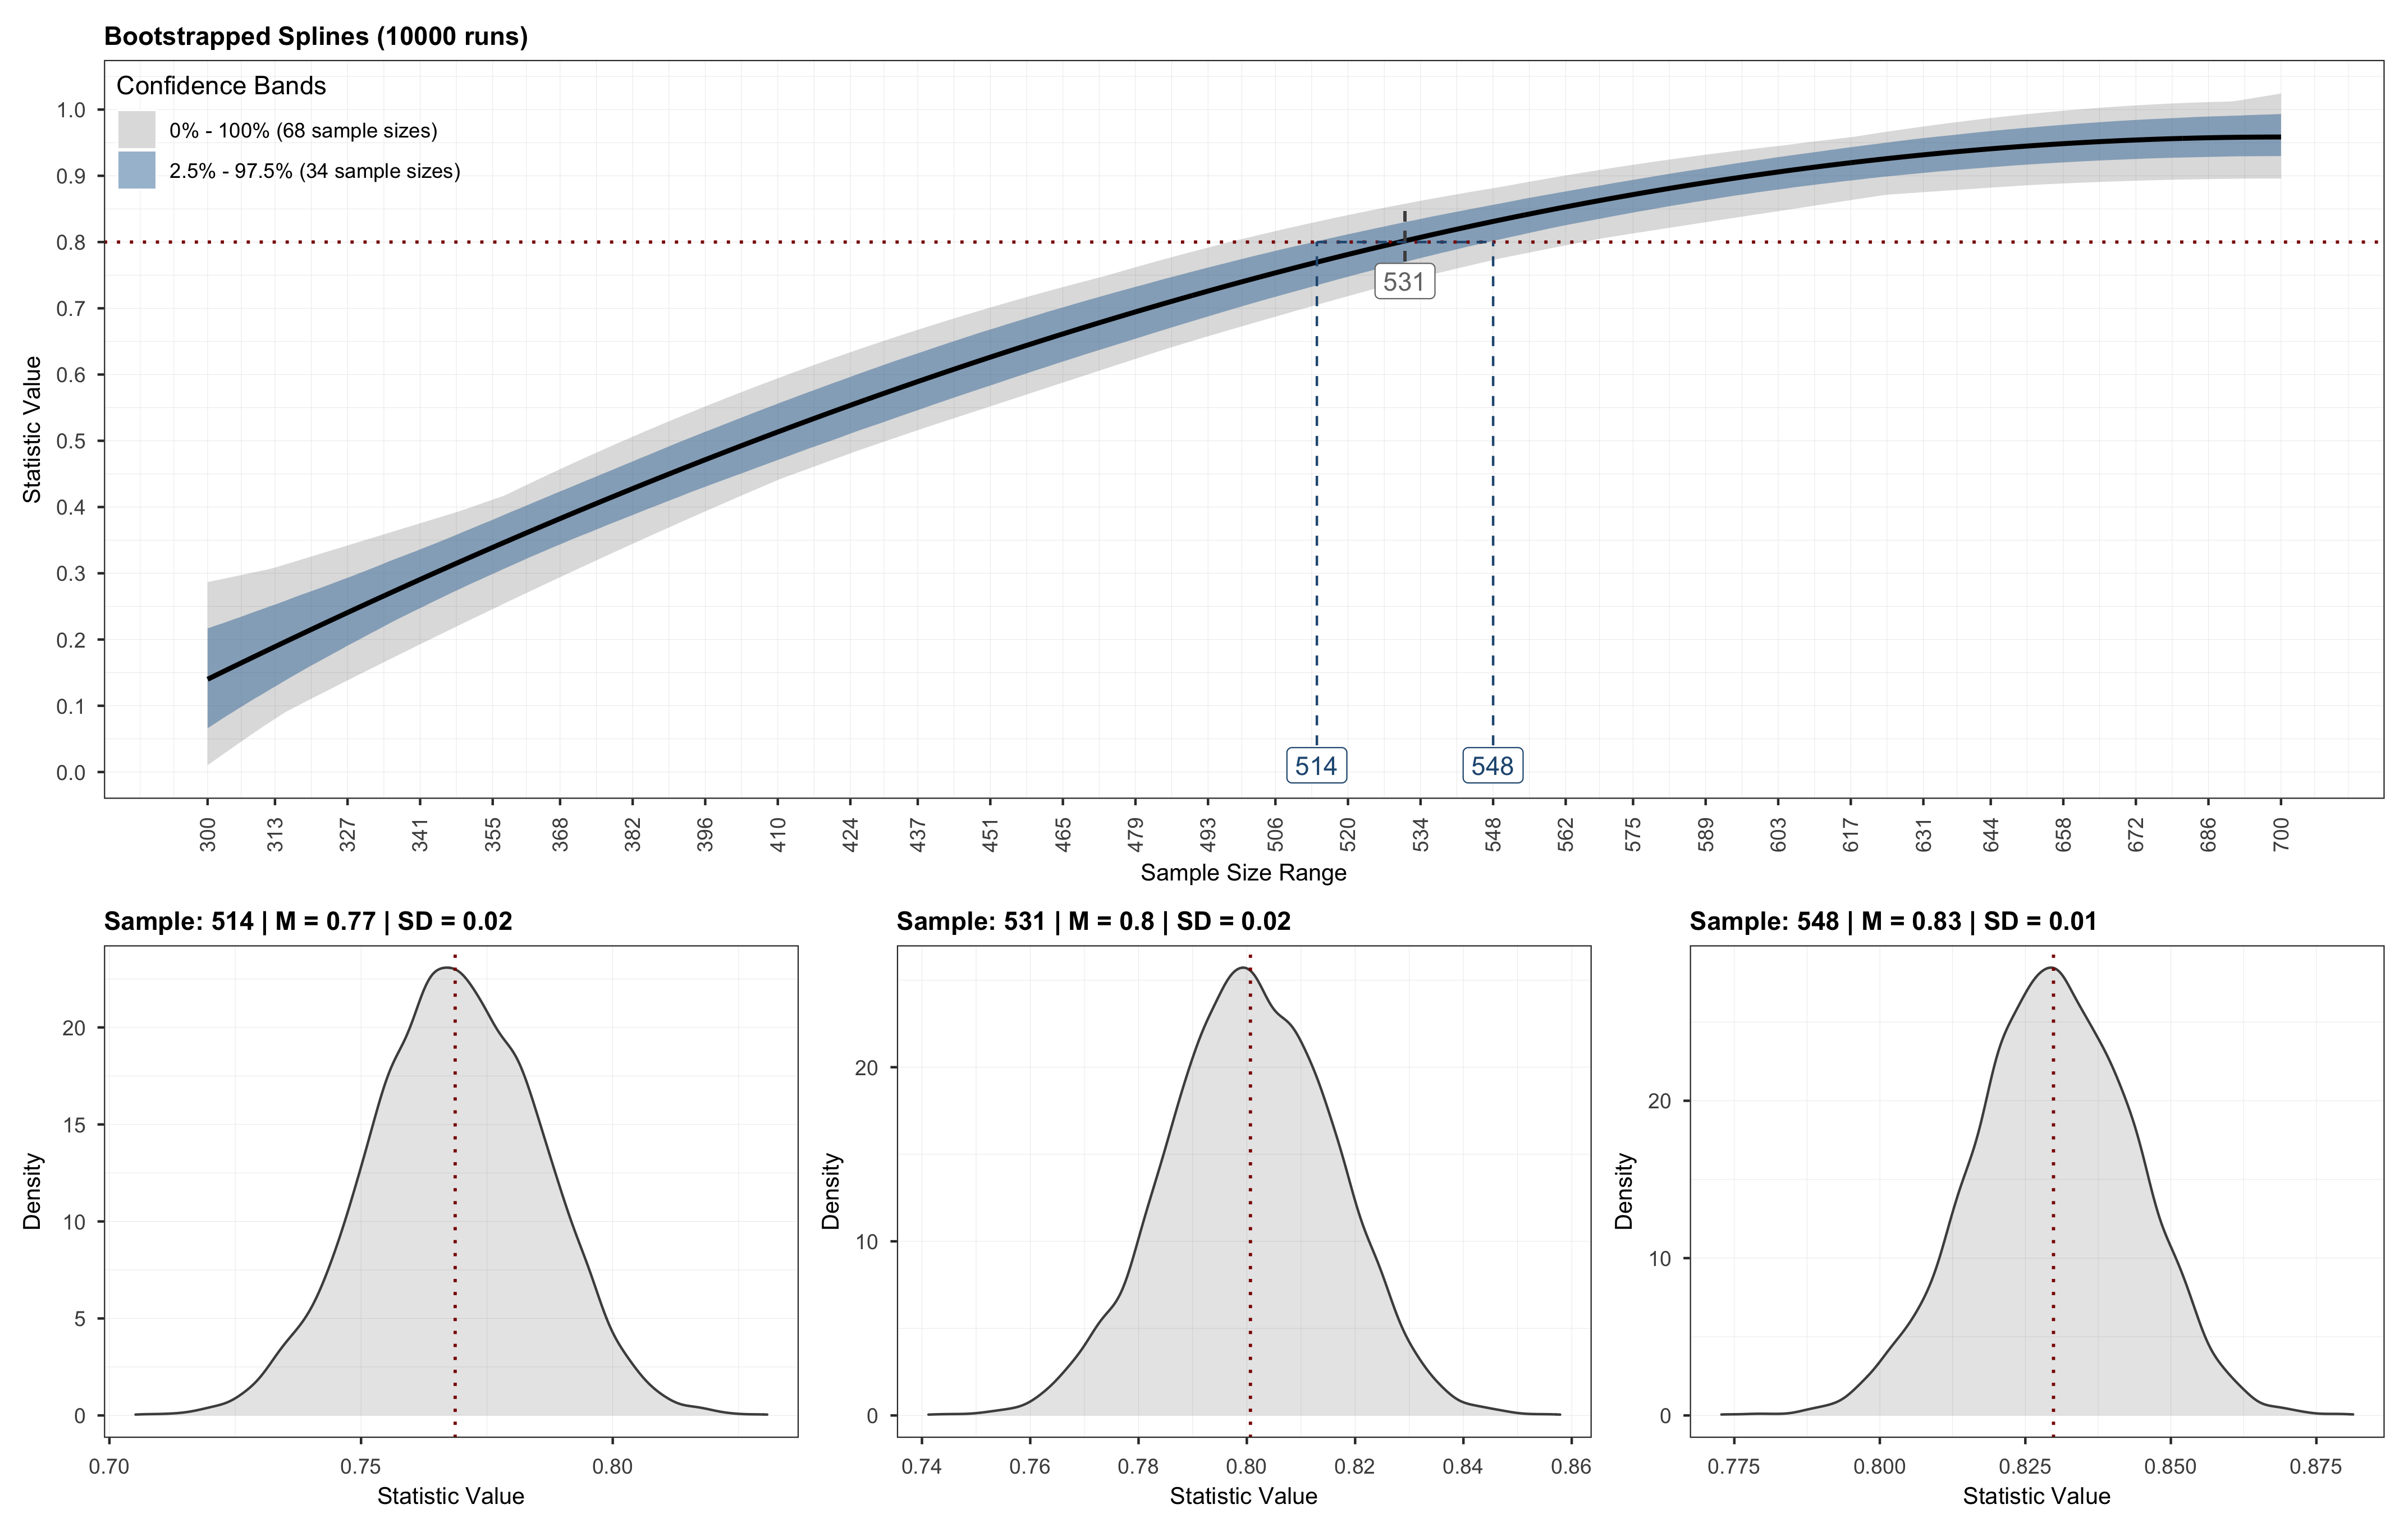
Or better visualize them.
# Plot method run.
plot(results)
Which will produce a plot similar to the one below.
Optionally, we may also validate the sample size recommendation using the validate function by passing in the output obtained from the powerly function, followed by plotting the validation results.
# Run validation.
validation <- validate(
method = results,
replications = 3000,
cores = 9
)
# Plot validation.
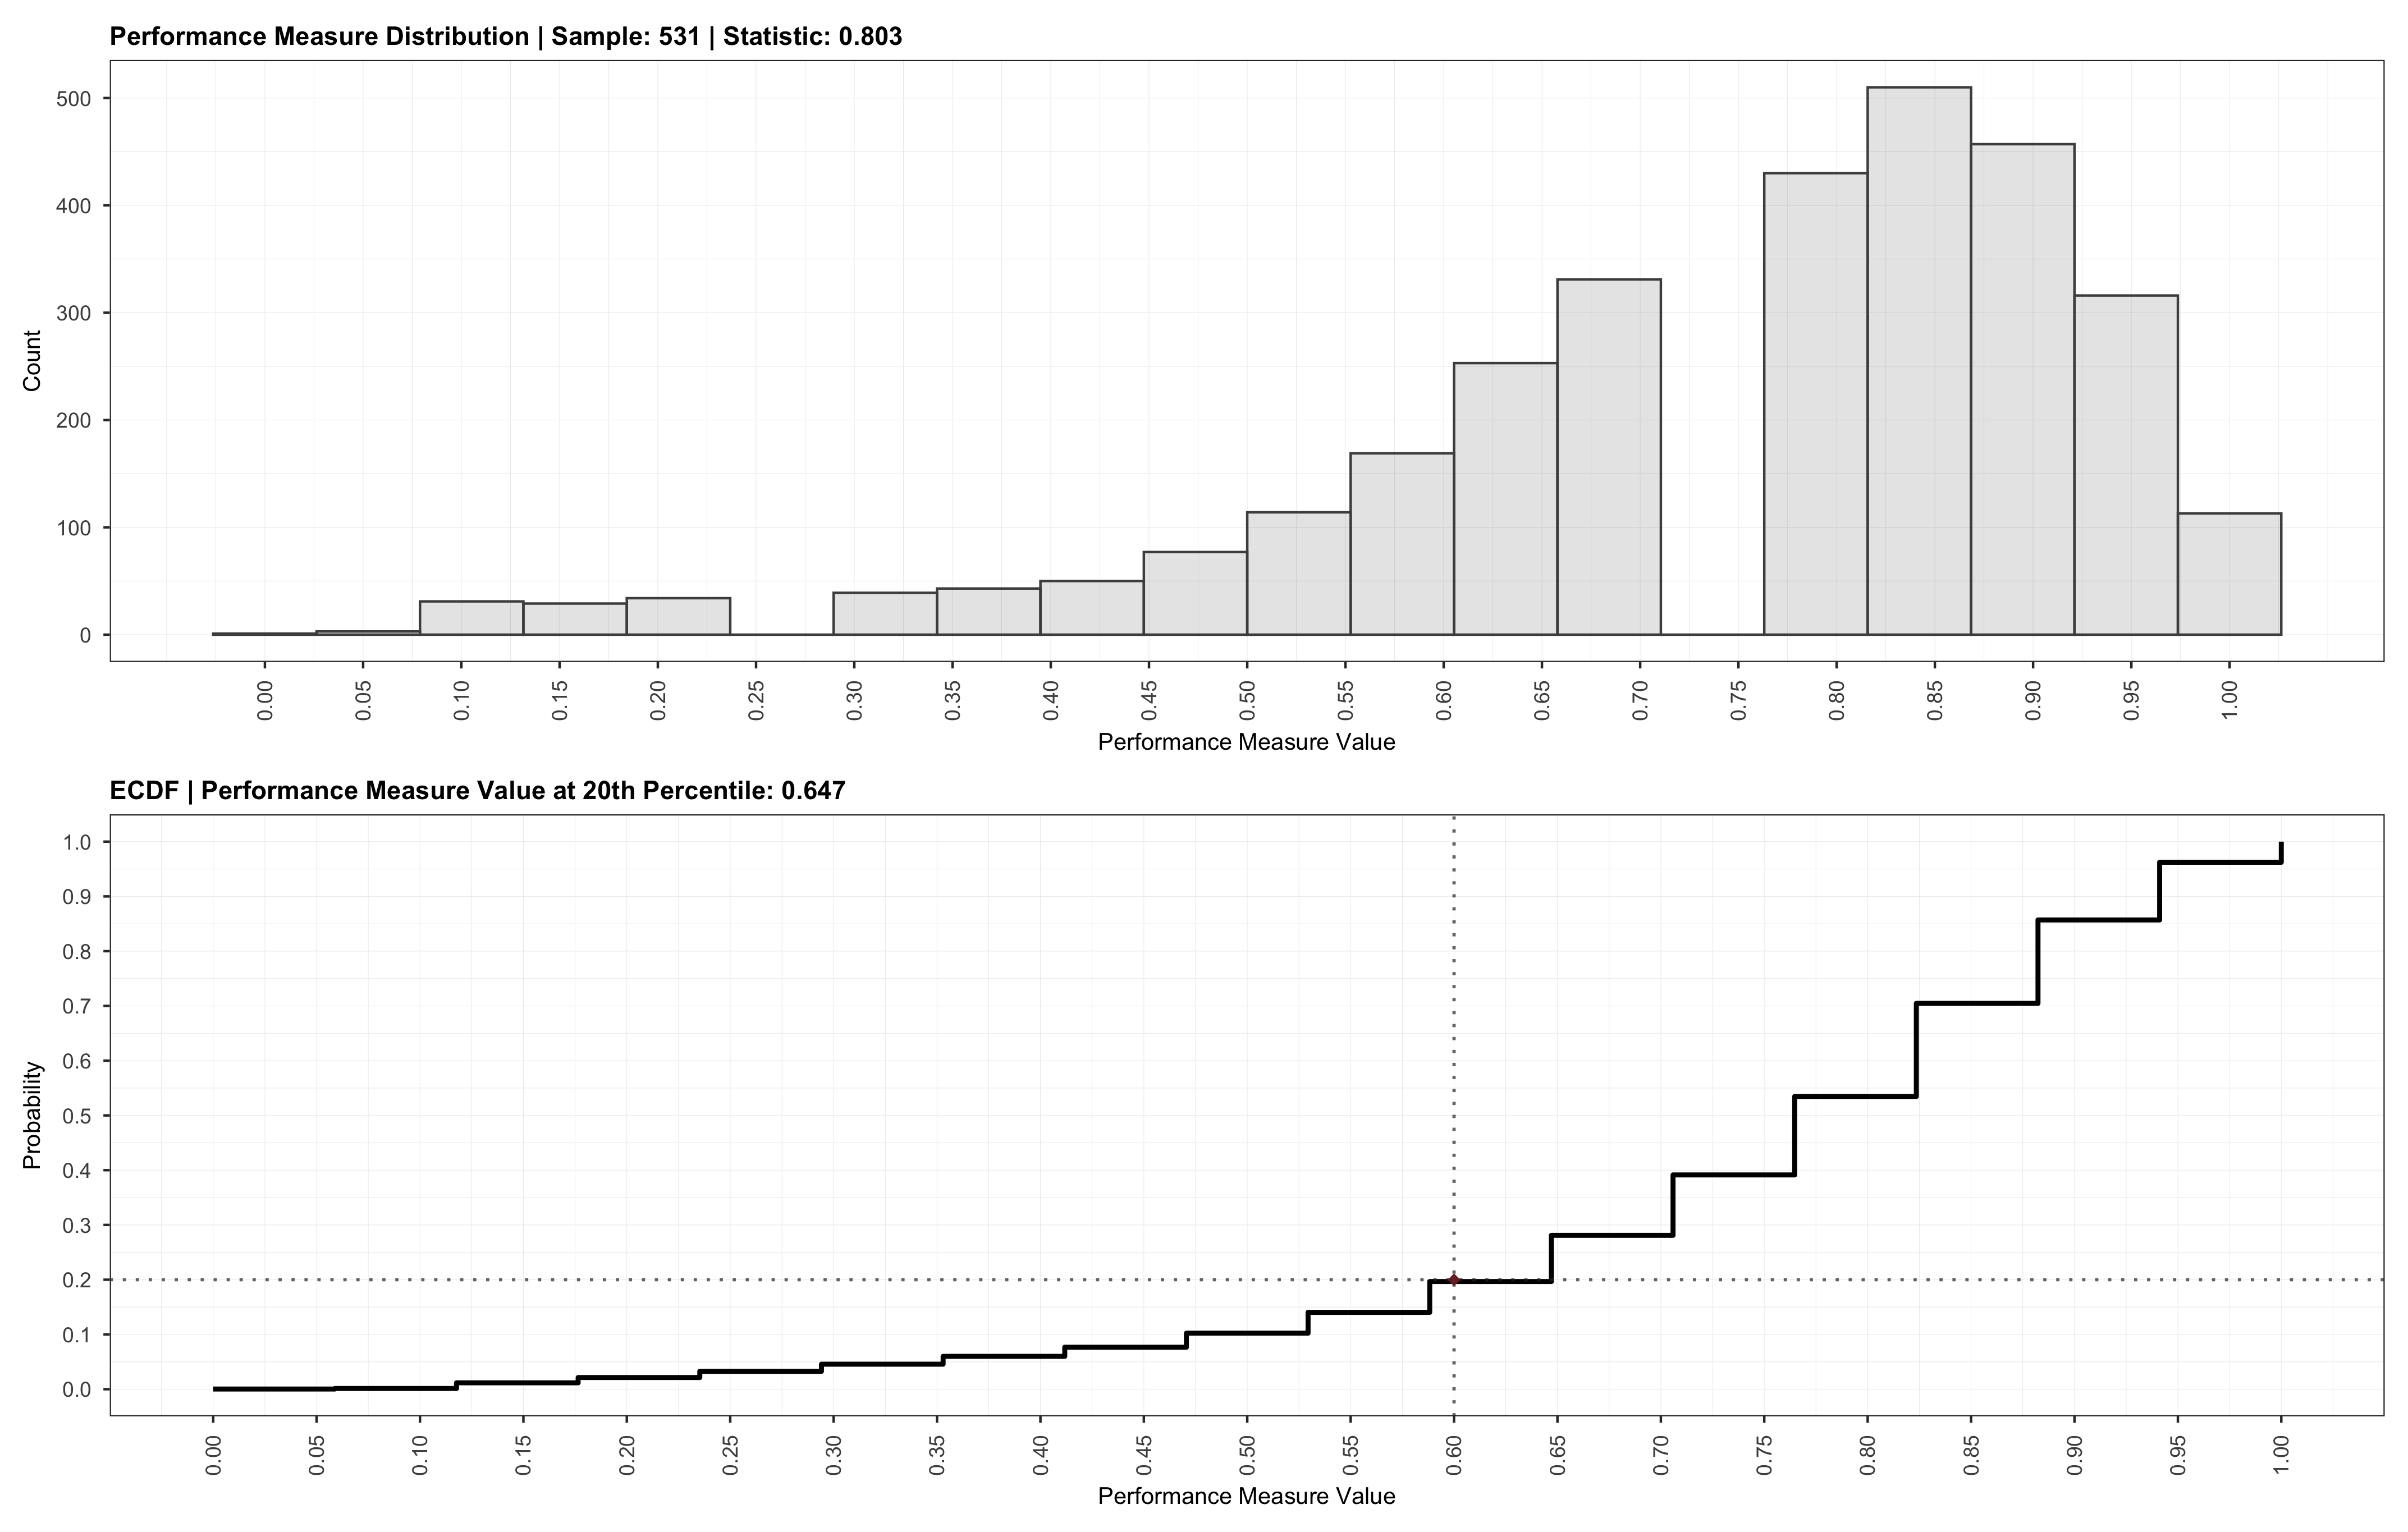
plot(validation)
Which will result in the following:
We may also choose to provide a specific sample size for the validation via the sample argument. In this case, the validation will be run for the provided sample size instead. Providing a specific sample value is akin to manually searching for an optimal value.
Next Steps
This introduction is intended to provide the bare minimum information needed to get started with powerly. If you want to learn more about where the numbers come from, I encourage you to check out the manuscript, or read the next post where I succinctly describe the terminology and the steps of the method. From there, you may continue with applications of the methods to different models (e.g., psychological networks, structural equation models etc.), or by checking out the posts under the FAQ, where I discuss tips and tricks for how to efficiently use powerly.