Plot Validation Results
Description
The plot.Validation S3 method plots the results of a sample size analysis validation.
Usage
plot(
    x,
    save = FALSE,
    path = NULL,
    width = 14,
    height = 10,
    bins = 20,
    ...
)
Arguments
| Name | Description |
|---|---|
x | An object instance of class Validation produced by the function validate. |
save | A logical value indicating whether the plot should be saved to a file on disk. |
path | A character string representing the path (i.e., including the filename and extension) where the plot should be saved on disk. If NULL, the plot will be saved in the current working directory with a filename generated based on the current system time and a .pdf extension. See ggplot2::ggsave for supported file types. |
width | A single numerical value representing the desired plot width. The default unit is inches (i.e., set by ggplot2::ggsave), unless overridden by providing the units argument via .... |
height | A single numerical value representing the desired plot height. The default unit is inches (i.e., set by ggplot2::ggsave), unless overridden by providing the units argument via .... |
bins | A single positive integer passed to ggplot2::geom_histogram representing the number of bins to use for the histogram plot. The default value is 20. |
... | Optional arguments to be passed to ggplot2::ggsave. |
Return
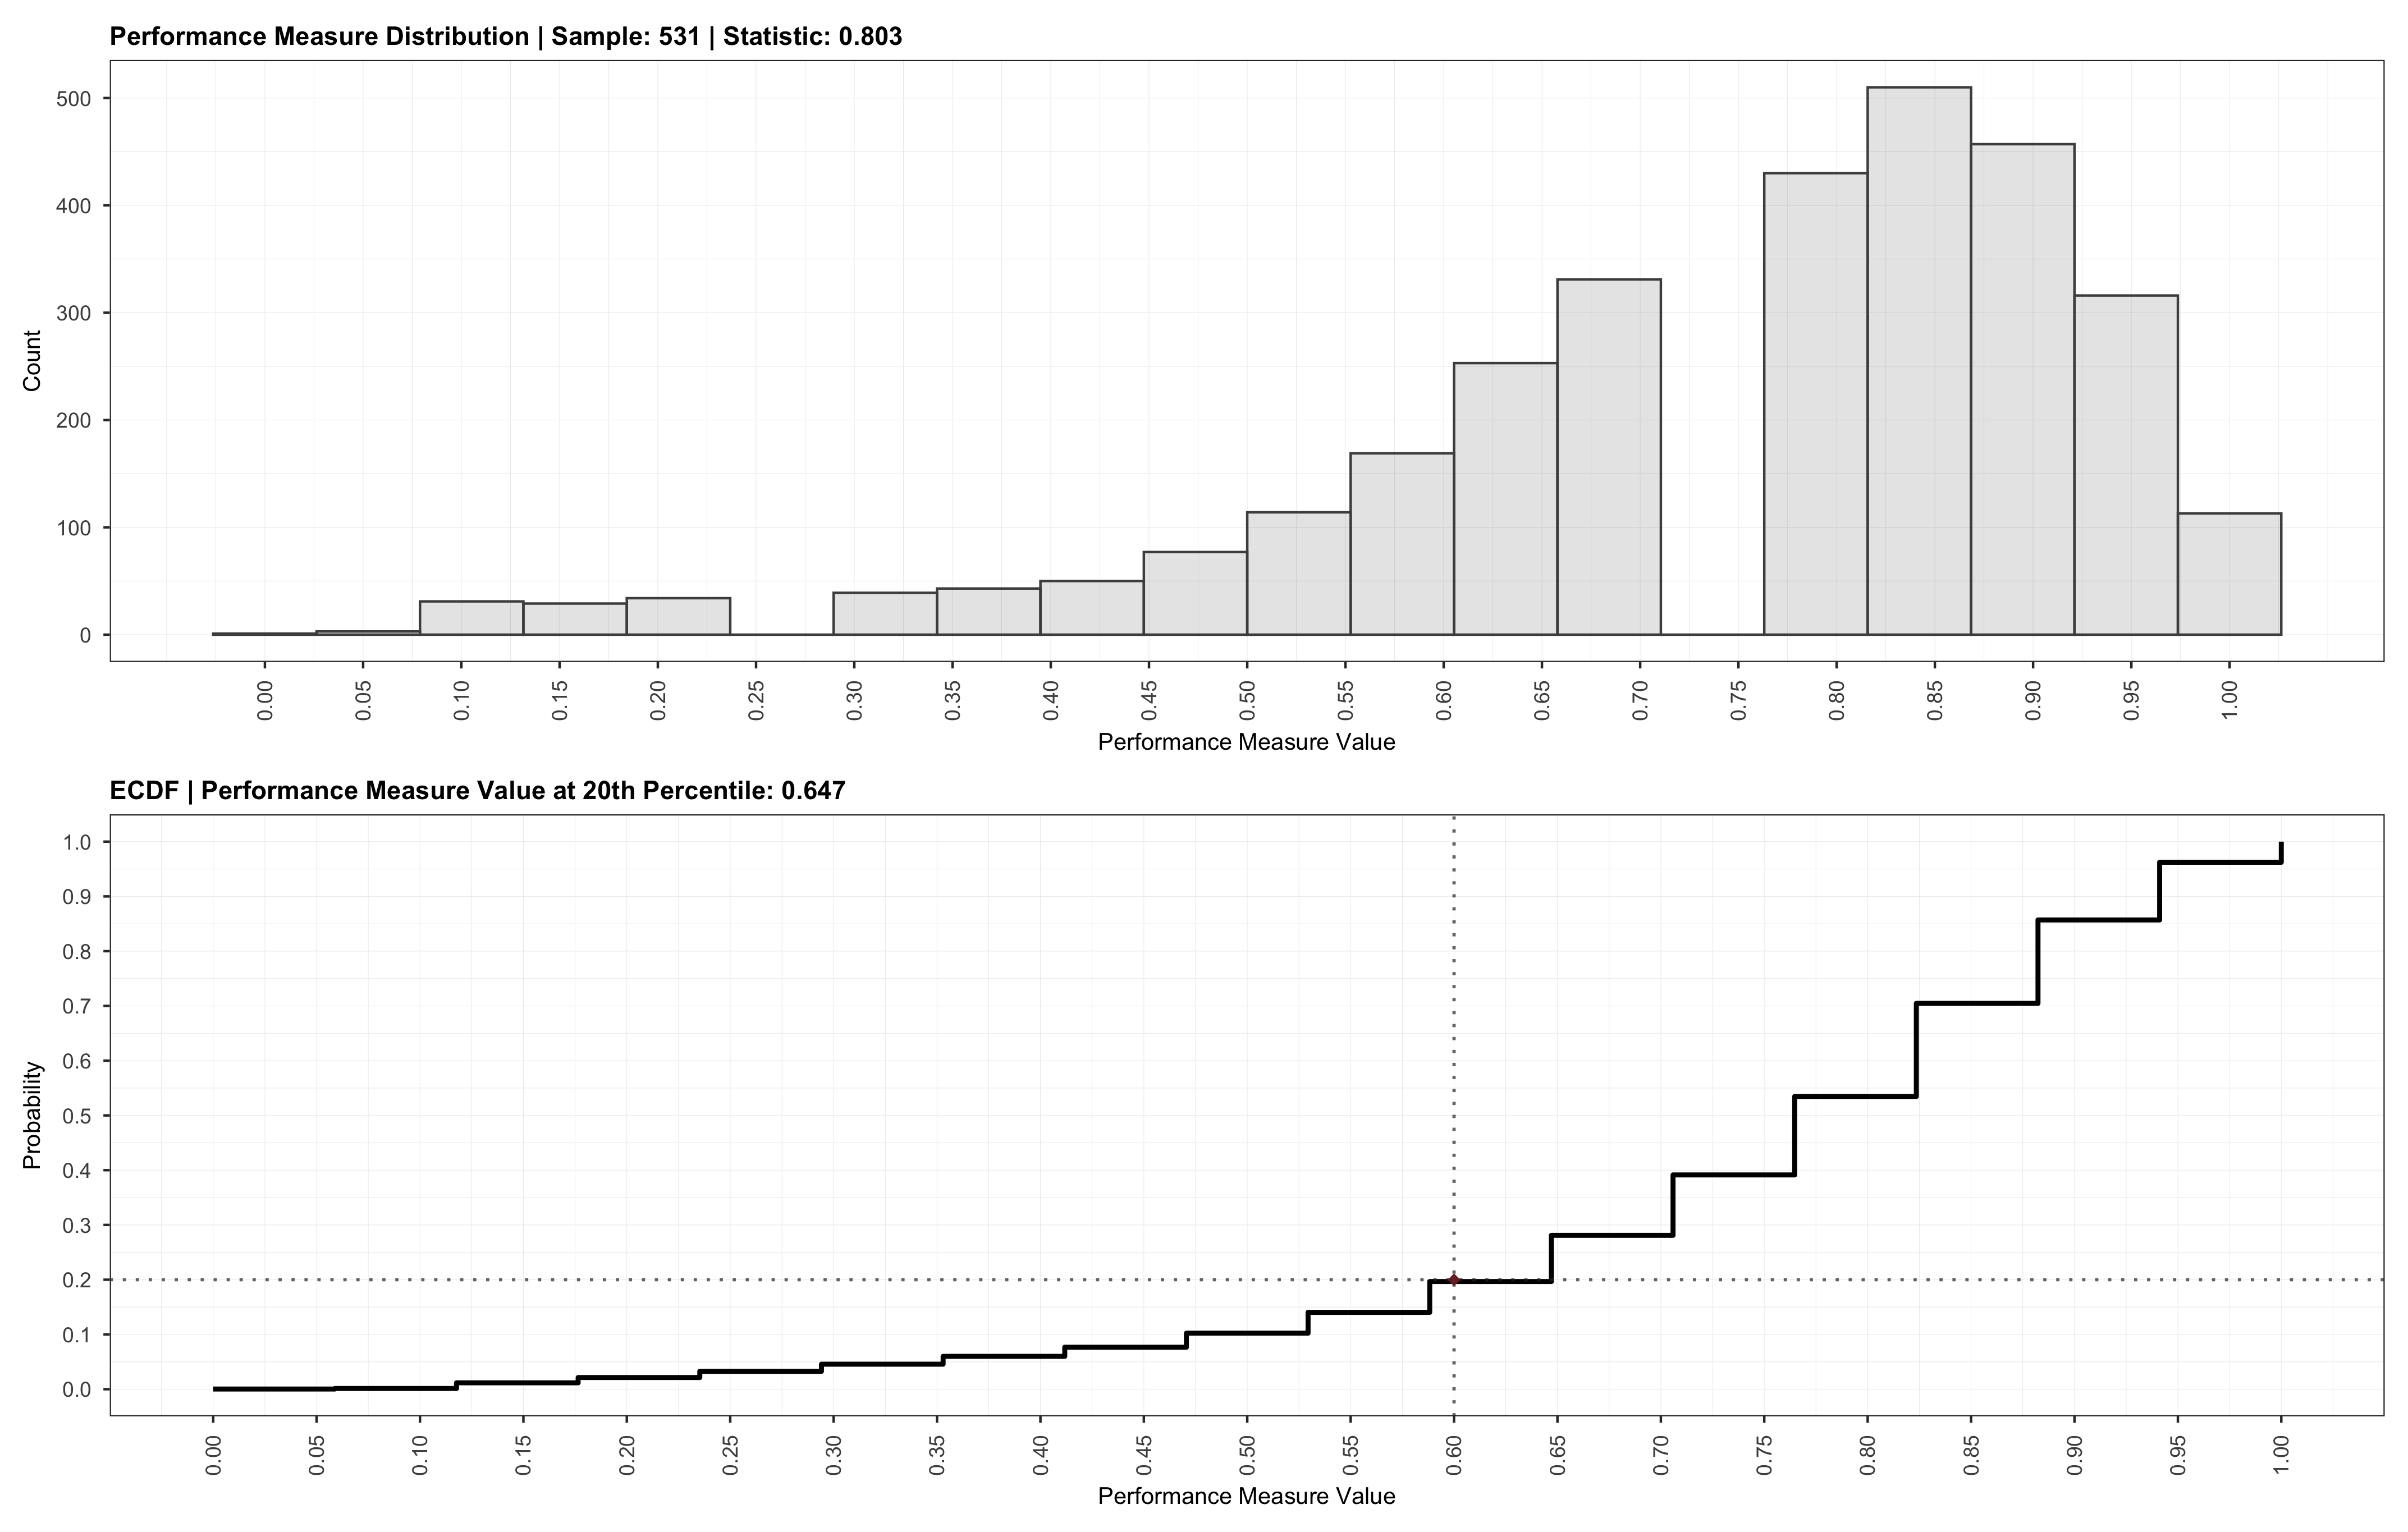
An ggplot2::ggplot object containing the plot for the validation procedure. The plot object returned can be further modified and also contains the patchwork class applied. An example of a validation plot is shown below.
Sample Size Analysis Validation